

Is zoning stopping the construction of new housing? This is a recurring debate in housing policy circles, with one side arguing that restrictions on apartments and townhomes are reducing supply and driving up prices. The other side claims that zoning is not the primary bottleneck, and that high construction costs and financing issues are more important. According to this second argument, legalizing apartments wouldn’t change anything, because developers aren’t willing to build them.
The simplest way to resolve this debate is to upzone and see if developers build more housing. Auckland upzoned to allow apartments and townhomes, and kicked off a construction boom, so restrictive zoning was clearly a constraint on housing supply. But how can we tell if zoning is a constraint when we don’t have evidence from a massive policy change?
Economists have come up with various ways to test whether zoning is a binding constraint. The general idea is that a constraint creates a wedge (or gap) that we can detect empirically. For example, when a developer wants to build a 20-storey apartment but zoning limits the height to 10 storeys, there will be a wedge between the cost of building one more floor and the selling price of the added homes. Without height limits, the developer would build up until the extra construction cost is equal to the selling price, so the wedge disappears. So if we do find a wedge between cost and price, we know that zoning is a constraint.
This “look for the wedge” method has been applied to height limits on apartment buildings (building up), minimum lot sizes preventing infill housing (building in), and urban growth boundaries restricting sprawl (building out). Economists call this wedge the ‘zoning tax’, because a tax also creates a wedge between supply and demand. Note that this is not simply a tax added to the price of housing; rather, we should interpret the wedge as evidence that zoning constraints are distorting the housing market.1
And when we look at the data, we find clear evidence that zoning has constrained housing supply in the US in recent years. Height limits reduce building sizes in New York, minimum lot sizes prevent small-lot houses in coastal cities, and Portland’s urban growth boundary limits construction at the city edge. If we want to increase the supply of housing, we must remove zoning constraints.
Building up: height limits
Imagine you’re a developer constructing an apartment building. If you can sell an apartment for $1,000 per square foot, and it costs $500 per square foot to add one more floor, then it’s profitable for you to build that floor. Since developers are profit-seeking, we wouldn’t expect to find cases of developers leaving money on the table, unless something prevented them from adding more floors to their building.
Glaeser, Gyourko, and Saks (2005) (published, working paper) study the zoning tax from height limits in Manhattan. Here the zoning tax is the wedge between the construction cost of adding one more floor to an apartment building and the selling price of the additional housing. They estimate construction costs of $300 per square foot, and condominium prices of $600 per square foot. Hence, the zoning tax is the $300 wedge, which the authors attribute to regulatory constraints preventing developers from adding housing supply. Think of the wedge as a signal of constrained zoning, not as the effect on housing prices.2
Brueckner and Singh (2020) (published, working paper) study the zoning tax from height limits in five US cities. They take a different approach: instead of comparing price and construction costs, they test whether vacant land sells at a higher price when the zoning allows for taller buildings. Intuitively, developers are willing to pay more for land with more valuable permitted uses, since they can get more revenue from a taller building with more homes.
They use data on vacant land sales over 2000-2018, and use floor area ratio (FAR) as a proxy for building heights.3 They estimate the correlation between land prices and height limits, and find a positive relationship: developers pay more for land that allows taller buildings. This correlation may not be causal, because city planners could zone for taller buildings in desirable areas that would have higher land values anyway. The authors attempt to mitigate this by comparing land sales within the same neighborhood.
New York City has the biggest sample of vacant land sales, so I’ll focus on the NYC results. The paper reports that a 10% increase in allowed building height is associated with a 3% increase in land prices. Looking at each borough separately, the largest effect is in Manhattan, where 10% higher allowed building height means a 6% higher land price. This is the zoning tax. If zoning wasn’t a constraint, then relaxing it should have no effect on land prices, like pushing on a string. When developers are already building as tall as they wish, they wouldn’t pay extra for land with more allowed height.4
Brueckner and Singh also show that the elasticity of land prices to allowed height is decreasing with distance to the city center. This means that height limits are binding more stringently as we move closer to the city center. In other words, height limits in NYC are most binding where buildings are already the tallest. The authors use a model to calculate that NYC building heights would be 33% higher without zoning regulations.5
Building in: minimum lot sizes
Imagine you own a house with a big backyard. One day a developer knocks on your door and offers you a bag of money to buy your backyard, so they can split the lot and build a new house there. If you value the cash more than the grass, you’ll take the deal. Here, land is more valuable when used as buildable space for a new house than as yard space. And we expect landowners to continue subdividing as long as buildable land is more valuable than yard land. But when zoning restrictions prevent this, by requiring a minimum lot size, then landowners are legally prevented from subdividing, and we get a wedge between the value of buildable land and the value of yard land.
Gyourko and Krimmel (2021) study the zoning tax from minimum lot sizes using data on 24 US metros over 2013-2018. The goal is to compare the value of yard land to the value of buildable land, so we need to estimate these two variables. For buildable land, they use vacant land transactions, which gives us the price of land that can be used to build houses.6 The authors observe or estimate the number of homes expected to be built on the vacant land, so we can calculate the land price per home.
For the value of yard land, they estimate the correlation between house prices and lot size using house sales near the vacant parcel. By seeing how much prices increase as lot sizes get bigger, we can calculate the price per square foot of yard land. They separate the yard value from the house value by controlling for various housing characteristics, including living area, number of storeys, location, and age. To get the total value of yard land, they multiply the price per square foot by the estimated lot size of the new houses, which they impute using the average lot size of new housing nearby.
For example, they observe a vacant land transaction in Marin County, in the San Francisco Bay Area. The parcel was 4 acres and sold for $10M. The developer planned to build 12 homes, so the value of buildable land per home was about $800k. Using nearby house sales, they estimate a yard land value of $300k per house. Gyourko and Krimmel then say that the zoning tax is $500k per house.
This isn’t quite right. The wedge is $500k, but this includes both the zoning tax and the cost of subdividing. For example, suppose you have a parcel of land that could fit two houses, but currently there’s a house right in the middle; to subdivide, you would need to tear down the existing house. But demolition is costly, so the payoff from building two houses needs to be large enough to cover those costs. Hence, even when minimum lot size is not a binding constraint, there could still be a wedge between yard land and buildable land values. So the authors overestimate the zoning tax by the amount of these subdividing costs, meaning the Marin County zoning tax is some amount smaller than $500k.7
The zoning tax number needs to be interpreted carefully. It represents how much more developers value buildable land than homeowners value yard land. It doesn’t mean that house prices would fall by $500k if minimum lot sizes were removed; instead, it just says that the wedge between buildable land and yard land would be reduced from $500k to near zero. In practice, we expect zoning reform to reduce the wedge from both sides: more subdividing would increase housing supply and reduce house prices, reducing the value of buildable land; and more subdividing means homeowners have smaller yards, so the marginal value of their remaining yard land increases. These two forces together close the wedge, say, with the value of buildable land and yard land equalizing at $600k.8
Gyourko and Krimmel estimate the zoning tax for 24 metros. I show their Figure 4 below, plotting the 25th percentile, median, and 75th percentile zoning tax in each metro, calculated for a quarter-acre of land. The sample of vacant land sales can be small, so the average value is sensitive to outliers; we should use the median instead.
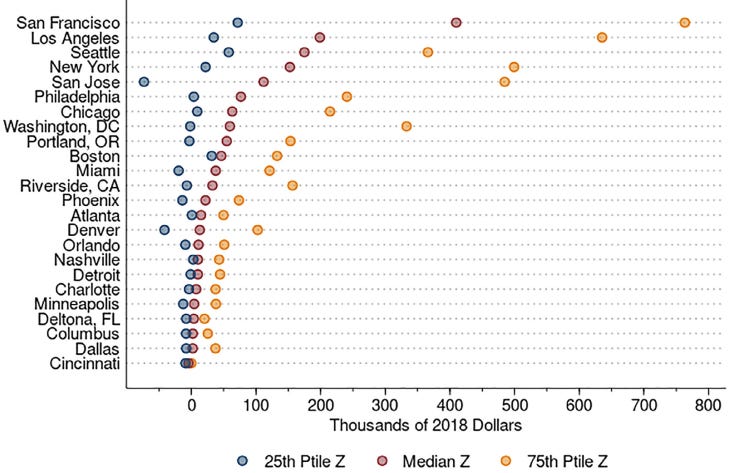
We see a clear pattern, with the largest zoning taxes in the coastal cities, and San Francisco having the biggest median wedge at $410k. Interior cities have negligible zoning taxes, implying that minimum lot size regulations are not a binding constraint. So zoning reform to allow subdividing is much more important in the coastal cities where the constraint is binding than in cities like Cincinnati.
Boston has a moderate zoning tax of $45k, despite having high housing prices; keep in mind that this is measuring only constraints on subdividing, and that Boston’s housing supply could be limited by other zoning regulations (for example, density constraints preventing apartments). Some of the values are negative, which shouldn’t happen; this shows that their method is somewhat noisy with small sample sizes (San Jose has only N=44 land transactions).
The authors also test whether the zoning tax varies with distance from the metro core. As you’d expect, in places like Atlanta with abundant land, the zoning tax decreases as we move away from the core (from $30k to $10k), meaning that zoning constraints are somewhat binding in central neighborhoods, and not in areas farther away. But San Francisco and Los Angeles have zoning taxes above $200k even for parcels more than 30 miles from the metro core. This tells us that minimum lot sizes are a binding constraint across the entire metro area, and not only in the center.9
Building out: urban growth boundaries
Imagine you own some agricultural land outside of the city’s urban growth boundary, meaning you’re not allowed to build a house on it. If you tried to sell to a developer, you would get much lower offers compared to your neighbor on the residential side of the boundary, who does have the right to build. By preventing outward development, the urban growth boundary creates a wedge between the price of residential land and the price of adjacent agricultural land.
Grout, Jaeger, and Plantinga (2011) study Portland’s urban growth boundary. Using assessed market land values, they compare the price of undeveloped land just inside and just outside the boundary; this approach controls for geography and isolates the effect of the urban growth boundary on land values. They report a price differential between $30k and $140k per acre on the western and southern sides of the Portland metro area, meaning residential land is more expensive. They find little to no difference on the eastern side.
So the urban growth boundary blocks new housing in the west, but not in the east. We can interpret this as the urban growth boundary being a binding constraint on development on the western side of Portland, and not binding on the eastern side. This makes sense if the west side is a more desirable location where people want to live, while there is still undeveloped land within the urban growth boundary on the less-desirable east side of the metro. The growth boundary redirects new development to a worse location.
However, this price differential is not equal to the zoning tax, which the paper doesn’t try to estimate. Since rural land lacks sewer and water services, we expect some nonzero wedge from infrastructure servicing costs, even when the urban growth boundary is not a constraint and the zoning tax is zero. But we can back out our own rough estimate of the zoning tax. The authors calculate a $10k east-side price differential; assuming the urban growth boundary is not binding, we can interpret this as the infrastructure servicing cost. Then the west-side zoning tax is the price differential minus this servicing cost, so $20k to $130k per acre. (If west-side servicing costs are higher, the zoning tax would be smaller.) If we removed the urban growth boundary, we would reduce the zoning tax from both directions: by reducing urban land values and by increasing rural land prices.10
Conclusion
The evidence is clear that zoning is a constraint on housing supply in the US, through height limits in New York City, minimum lot sizes in high-demand coastal metros, and the west side of Portland’s urban growth boundary. The next step is using this evidence to guide policy. City planners should use these metrics to identify where zoning regulations are a constraint, and prioritize upzoning where the zoning tax is largest. New Zealand is moving in this direction, with a dashboard measuring the price differential between urban and rural land. Evidence-based housing policy should follow this example, using the zoning tax as a diagnostic for binding constraints on supply.11
To estimate the effect of zoning on home prices, we need to know supply and demand elasticities, to say how much a shift in supply will reduce prices.
Also keep in mind that the optimal zoning may be nonzero, so the optimal zoning tax is also nonzero. If zoning prevents externalities from higher-density housing (e.g., congestion, blocked views), it can pass a cost-benefit test.
It doesn’t follow that removing zoning constraints would reduce home prices by $300psf. That would be true if marginal costs remained constant as developers built taller. But if marginal costs increase, then the gap can close from a combination of lower prices and higher costs. So we could have price=marginal cost=$450psf. Generally, we need to know the demand and supply elasticities to know how much upzoning will reduce prices.
FAR is the ratio of a building’s total floor area to the area of the land it sits on. At FAR=1, a 1-storey building could cover the entire lot, or a 2-storey building could cover half of the lot.
The authors claim that site coverage does not vary much, making FAR a good proxy for height limits; but this assumption is not defended.
Brueckner and Singh find a surprisingly small effect in San Francisco, though using a smaller sample of land sales. One possible explanation is that San Francisco uses inclusionary zoning to capture land value uplift, so the after-tax price of high-FAR land is the same as the price of low-FAR land. If the city captures all land uplift, then the elasticity would be zero. The authors do not discuss this.
NYC regulated heights are roughly 75% of free market heights (Table 7); so building heights would be (1-0.75)/0.75 = 33% higher without zoning regulations.
Brueckner et al. (2017) (published, working paper) apply the same method to Chinese cities, and also report an elasticity of land prices to allowed FAR of 0.3. Brueckner and Sridhar (2012) (published, working paper) regress urban area on height limits, and shows that zoning restrictions increase urban sprawl in India.
Glaeser and Gyourko (2003) introduced this method for estimating the zoning tax from minimum lot sizes. They didn’t have data on vacant land sales, so they impute the extensive margin value of buildable land as house prices minus construction costs.
Similarly with geometry problems: developers need contiguous land, so disconnected strips of land may have yard-value < buildable-value, but cannot be assembled without complete redevelopment. The model assumes frictionless subdivision, but in practice frictions prevent the wedge from being exactly zero.
The effect of eliminating the zoning tax on housing depends on supply and demand elasticities. When housing supply is perfectly elastic, housing prices would fall until the buildable value equals the initial yard land value (at $300k). But when housing demand is perfectly elastic, housing prices are fixed, so yard land value rises until it equals the initial buildable land value (at $800k). In each case, the zoning tax is reduced to 0, but the effects on housing prices are completely different.
The paper says that zoning “added $2.875 billion in land value” to 69 parcels in San Francisco. Strictly speaking, this means that the $2.8B was added to the extensive margin relative to the intensive margin; it doesn’t mean that raw land prices increased by that amount (except in the case of perfectly elastic supply).
It would be interesting to apply this method to Auckland’s upzoning, and test whether upzoning reduced the size of the zoning tax.
Turner et al. (2014) compare land values between municipalities with different levels of land use regulation. Parcels on opposite sides of the municipal border share the same location, but face different regulations, allowing us to isolate the effect of zoning. They report that land values fall as we cross into a more-regulated municipality, capturing the idea that developers pay less for land with fewer development rights. This approach generalizes the UGB method, by comparing the price of high- and low-density land on either side of a regulatory boundary.
Zhang (2023) gives a unified framework for understanding the various forms of zoning taxes. Ultimately, each metric captures the value of marginally relaxing a zoning constraint, which is how much a landowner benefits from getting extra development rights. This is easy to see with the urban growth boundary, which creates a wedge between the land price of residential and agricultural land. Similarly with height limits, where being allowed to build taller leads to higher land values. Zhang shows that the wedge between price and marginal cost can also be interpreted as the value of relaxing zoning constraints. And while not shown, the same logic applies to minimum lot sizes and the wedge between yard land and buildable land.