
Vacancy chains
How building expensive new homes today lowers the price of old homes today

People typically think about housing using a 'one-sector' supply and demand model: increase supply and prices fall. But we often hear the complaint that new housing is expensive, and hence is not a good solution for improving affordability. To address this complaint, we need to extend our one-sector model to a two-sector model. Instead of a single homogeneous housing good, we now have submarkets with High- and Low-quality homes (and we can further generalize to many quality levels). This captures the motivation of the complaint: new housing tends to be high quality, due to using new materials and modern construction techniques, and high quality housing is inherently more expensive.
With this framing, the question now becomes: how does increasing the supply of High-quality affect prices of High- and Low-quality homes? If the High and Low submarkets are disconnected from each other, then we expect a shift in High-quality supply to reduce High-quality prices, but have no effect on Low-quality prices. In contrast, if the submarkets are connected, then increasing High-quality supply will reduce the prices of both High- and Low-quality homes.1 Hence, the key empirical question is whether housing submarkets are interconnected.
One key mechanism connecting submarkets is a vacancy chain. When person A moves into a new home H0, they vacate their previous unit H1; person B moves into H1 and vacates their original home H2; then person C moves into H2, freeing up their home for someone else, and so on. This occurs because housing is a durable good: when you're done using a home, someone else can re-use it. So if a vacancy chain initiated by an expensive new building reaches cheaper homes in poorer neighborhoods, then the High and Low submarkets are in fact connected, and increasing High-quality supply will reduce Low-quality prices. The policy implication is that simply allowing developers to build market-rate housing can improve housing affordability for everyone.
Vacancy chains occur when locals upgrade their housing situation, moving into a new building and vacating their previous unit. For example, think of young professionals getting a higher-paid job. The chain ends when the previous unit is not vacated, as when an adult child moves out of their parents’ home. And when someone moves into a new building from out-of-town, they still create a vacancy, but in their original city.2
Note that vacancy chains can occur quickly, within one year. For example, consider people A, B, and C living in homes H1, H2, and H3 in 2023. In 2024, a new home H0 is built and A moves in, leading B to move into H1 and C to move into H2; all of the moves take place during 2024.3 Over time, the housing allocation looks like this:
2023: (A,H1), (B,H2), (C,H3)
2024: (A,H0), (B,H1), (C,H2)
These are short-run effects, as opposed to depreciation, where it takes decades for a new home to become cheaper as it ages and becomes lower-quality.4
Quantifying the vacancy chain effect
Lansing et al. (1969) was the first to study vacancy chains in housing. They showed that, in later rounds of a chain, lower-income families are more common (Table 6) and home prices are lower (Graph 1). A recent literature updates these results using administrative data.
Bratu et al. (2023) (published, working paper) studies vacancy chains in Finland using register data on all residents over 2009-2019. They look at chains created by new multi-family buildings built near the Helsinki central business district. Because they can link individuals to housing units, they can trace out the exact vacancy chain.
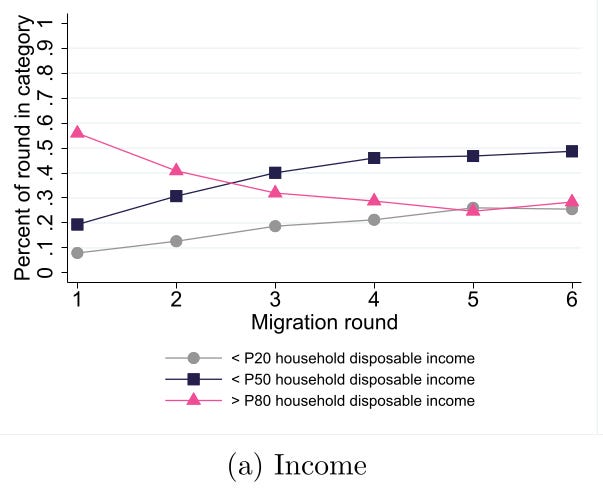
In the first round of the chain, 20% of movers into a new building have incomes below the median. But by the fourth round, 50% of movers have below-median income (see their Figure 3a below). This shows that new market-rate buildings that are unaffordable for the poor do indirectly free up other housing that is affordable. The fraction of chains with a link in a below-median-income neighborhood is 66%; the other 34% of chains end in above-median-income neighborhoods. This means that building 100 new market-rate units will free up 66 units in below-median-income neighborhoods.
They also study the vacancy chains created by rent-controlled social housing. As you'd expect, these chains reach below-median-income neighborhoods more quickly, since the first movers are more likely to be low-income.
Mast (2023) (published, working paper) was the first paper in the recent economics literature on vacancy chains, using US data. Because his data is at the building level, tracing the chain is a bit fuzzier. But the results are similar: after six rounds, 40% of new residents are from below-median-income neighborhoods. Mast runs a simulation to compare to the no-construction scenario, where the new building was not built (in contrast, Bratu et al. compare to before the new building was built). He finds that building 100 units of new market-rate housing frees up 45-70 units in below-median-income neighborhoods. (Since Mast has neighborhood-level income data, it could be the case that richer people are moving out of poorer neighborhoods; with household-level data, Bratu et al. are able to compare both approaches, showing that Mast’s results are slightly overstated.)
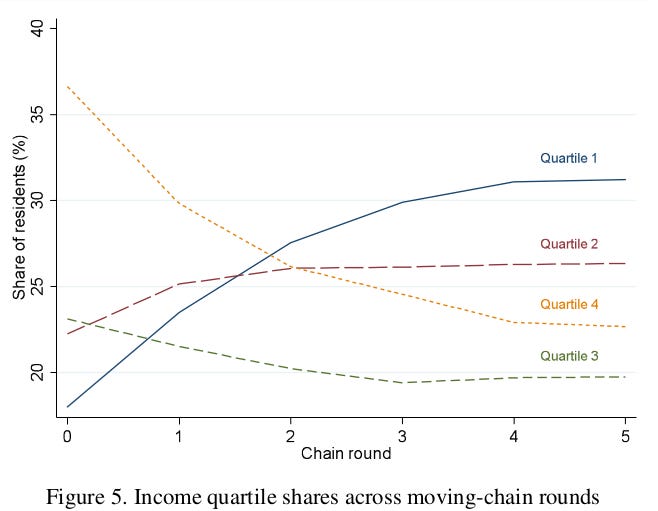
Kindström and Liang (2024) (working paper) repeats the vacancy chain analysis for Sweden, using register data on all residents over 1990-2017, and tells the same story: while people moving into the new building are richer, the poorest quartile becomes the largest group of in-movers (27%) by the third round of vacancies (see their Figure 5 below). Even when looking at chains initiated by above-median-income buildings, the poorest quartile makes up 30% of movers by round 6 (see their Figure 7). So even new buildings that are aimed at rich people create vacancy chains that include poor people.
Fang et al. (2025) (working paper) studies vacancy chains created by a single 512-unit condo tower in Honolulu. They follow movers using residential histories from a private data company, and use property assessment data to test whether the vacated homes are cheaper. Their data coverage is imperfect, identifying about half of the occupants in the new building. The building has 202 market-rate and 310 income-restricted units, which allows them to test for differences by housing type.
The main finding is that vacated homes are much cheaper than the new condo units. Their Figure 5 shows that the assessed price per square foot was $1152 in the new units, but only $715 and $642 in the homes freed up in rounds 1 and 2 of the chain. This effect is stronger for chains initiated by income-restricted units, consistent with Bratu et al.’s results for new social housing. The new units are also smaller than the vacated homes, indicating that the new residents are both upgrading and downsizing.
Sources of chain breaking: household formation, in-migration, measurement
Chains can end for several reasons. First, when a new household forms, the mover’s original unit may not be vacated, so the chain ends. This occurs when roommates split up, or when an adult child moves away from their parents. (Note that the chain could continue even when the origin unit is not fully vacated. For example, one roommate may move out and vacate a bedroom, allowing a new roommate to move in. The papers above are not able to account for this, which biases chain length downwards.)
Second, the vacated unit may be in another city, as occurs when the new resident is a migrant. These papers treat in-migration as ending the chain, but in reality the chain continues in the migrant’s origin city. Hence, these descriptive results understate the causal effects of new housing.5
Third, chains can end because the origin unit is vacant during the measurement period. For example, if A moves out of H1 and into H0 in December 2023 (vacating H1) and B moves into H1 in January 2024, the chain will end because H1 was vacant in December 2023. It is not clear how Bratu et al. and Kindstrom and Liang address this.
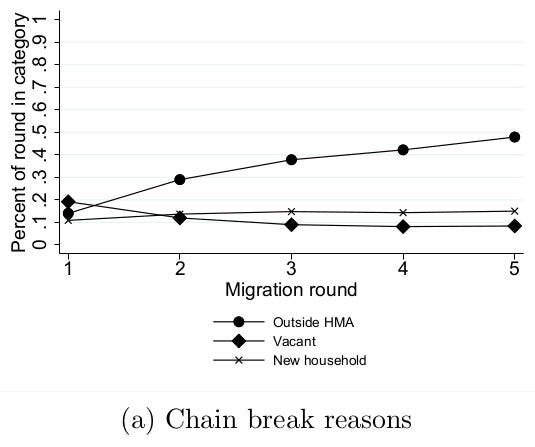
Figure A7 (below) in Bratu et al. decomposes the sources of chain terminations. Vacancies are the largest factor in the first round, while 50% of all chains break in round 5 due to in-migration. Future papers should report these statistics to allow cross-country comparisons.
Open questions
It would be informative to understand how vacancy chains vary across cities. For example, are chains more likely to reach below-median-income neighborhoods when young professionals make up a bigger share of the population (so that moves are from local upgrading rather than in-migration)? Are chains shorter when a city has higher inequality (so moves across neighborhoods are less likely)? Are chains longer when initiated by apartments vs. single-family homes, or rentals vs. condos? How many rental homes are freed up by a new condo, and vice versa?
If vacancy chains effectively add homes in poorer neighborhoods, how much can city governments rely on providing new market-rate housing as a way of meeting ‘affordable’ housing targets?6 Similarly, how should governments account for old homes freed up by the construction of new subsidized housing? Can we use data on housing prices to show directly that vacancy chains free up cheap housing? If new housing involves tearing down cheap old homes, how much does density need to increase to maintain the stock of cheap homes (via vacancy chain effects)?
Applications of vacancy chains
Mense (2025) (published, working paper) studies the effects of housing supply on rents in Germany, using delays in housing construction caused by rain and snow. He finds that a 1% increase in new supply reduces rents by 0.19% on average. This effect holds across the distribution of housing quality: rents fall by 0.13% in the first decile of quality and by 0.28% in the ninth decile. This is consistent with the quality submarkets being connected by vacancy chains: new high-quality supply enables move-ins and move-outs that ultimately reach the lowest-quality homes. Mense cannot trace out the vacancy chains, since he does not have data on individual address histories. But he does build a structural model based on the vacancy chain mechanism, where new supply initiates a vacancy chain and renters move across quality levels. This mechanism is a natural explanation for why adding high-quality homes decreases rents over the entire quality spectrum.7
Both supply and demand shocks propagate through interconnected submarkets
The other way housing submarkets are connected is by a reverse vacancy chain, or a 'demand cascade': when a rich person moves into a city and housing supply is constrained, they outbid an existing resident for High-quality housing. In turn, that existing resident downgrades to a Low-quality home, where they outbid someone else, who now has to double up (e.g., move in with family), become homeless, or move away. When an increase in High-quality demand is not absorbed by an increase in High-quality supply, it cascades down the quality submarkets. Hence, the connectedness of submarkets works for both supply increases and demand increases.
Appendix
Here’s how we can model a vacancy chain using supply and demand. There are two submarkets, for High- and Low-quality homes. Shifting S_H right (and moving along D_H, which decreases P_H) causes a shift left in D_L. See here for details.
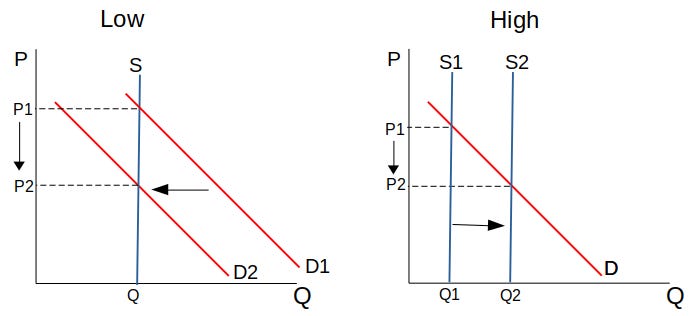
In technical terms, there is a nonzero cross-price elasticity of demand between High- and Low-quality homes, where Low quantity demanded falls in response to a decrease in High-quality prices. So the causal chain is: increase the supply of High-quality homes, decrease the price of High-quality homes; this reduces demand for Low-quality homes, which decreases the price of Low-quality homes.
This shows how housing policy is fundamentally regional, and needs to be set by higher-level governments to internalize externalities. When local governments are in charge of zoning policy, they do not account for the costs and benefits they impose on their neighbors. For example, restricting housing supply induces outmigration to neighboring areas, and increasing local supply reduces housing demand in neighboring areas.
When using tax data, we observe the residential address where someone lived on Dec 31 of each year. So to define person A moving from H1 to H0, we need to observe A living in H1 on Dec 31, 2023, and living in H0 on Dec 31, 2024.
‘Filtering’ is closely related to vacancy chains and depreciation. A home filters down if each successive household is ranked lower in the income distribution than the household it replaced; a home filters up when the opposite occurs. Depreciation refers to a home losing value as it wears down with age. Because of depreciation, there is a wide distribution of housing quality in the market. A vacancy chain moves across this quality distribution, and the relative income of the new household determines whether a particular home filters down or up.
Getting the counterfactual right can be tricky: what happens when we don’t build the new home H0? If the migrant would have moved to the city regardless of the vacancy chain, then the counterfactual is that they occupy a different unit (H_C) in the city, instead of remaining in their origin city. Using this counterfactual, constructing a new building (and initiating a vacancy chain) vacates the unit the migrant would have lived in (H_C), and the chain proceeds from there; Mast takes this approach in his simulation exercise. So specifying the counterfactual affects how we trace out the chain.
Elmendorf et al. (2021) applies this idea to California: “If San Francisco received, say, a moderate-income credit of 0.5 units for each new market-rate unit above its “above moderate income” target, the city could meet its moderate-income RHNA (about 20 percent of the total) by permitting twice as many market-rate units as its above-moderate-income target.” (p.985 fn.66)
Note that Mense uses a 'flow' model of vacancy chains, focusing on homes 'on the market'. We shift S_H right, which lowers P_H and induces upgrading, shifting D_H right; as vacated L units are added to the market, S_L shifts right. In contrast, my discussion above uses a 'stock' model, focusing on the entire stock of homes. Here, shifting S_H right lowers P_H and induces upgrades, which shifts D_L left; in this case, S_L is fixed.